Web tool for tracking local climate targets
EnergieSamen needed to see how far local energy production had progressed against the climate targets set per region. The data existed, but not in a form anyone could interrogate at the level where decisions are actually made.
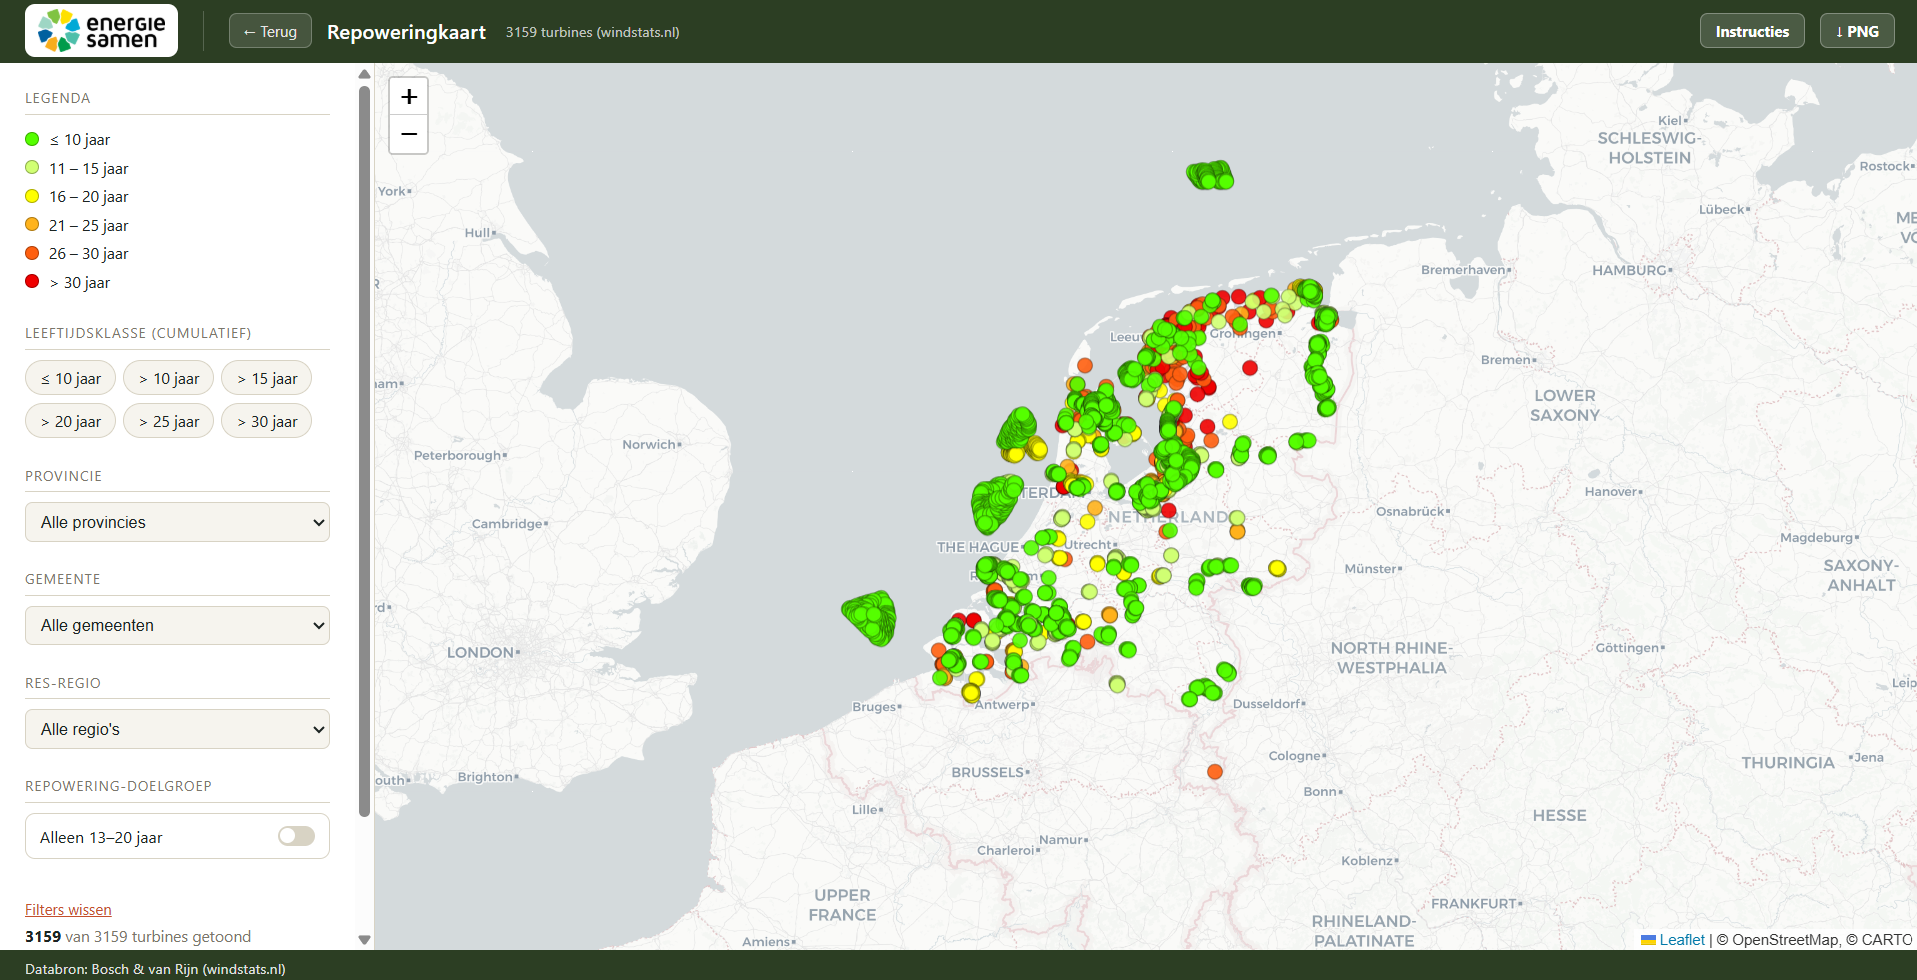
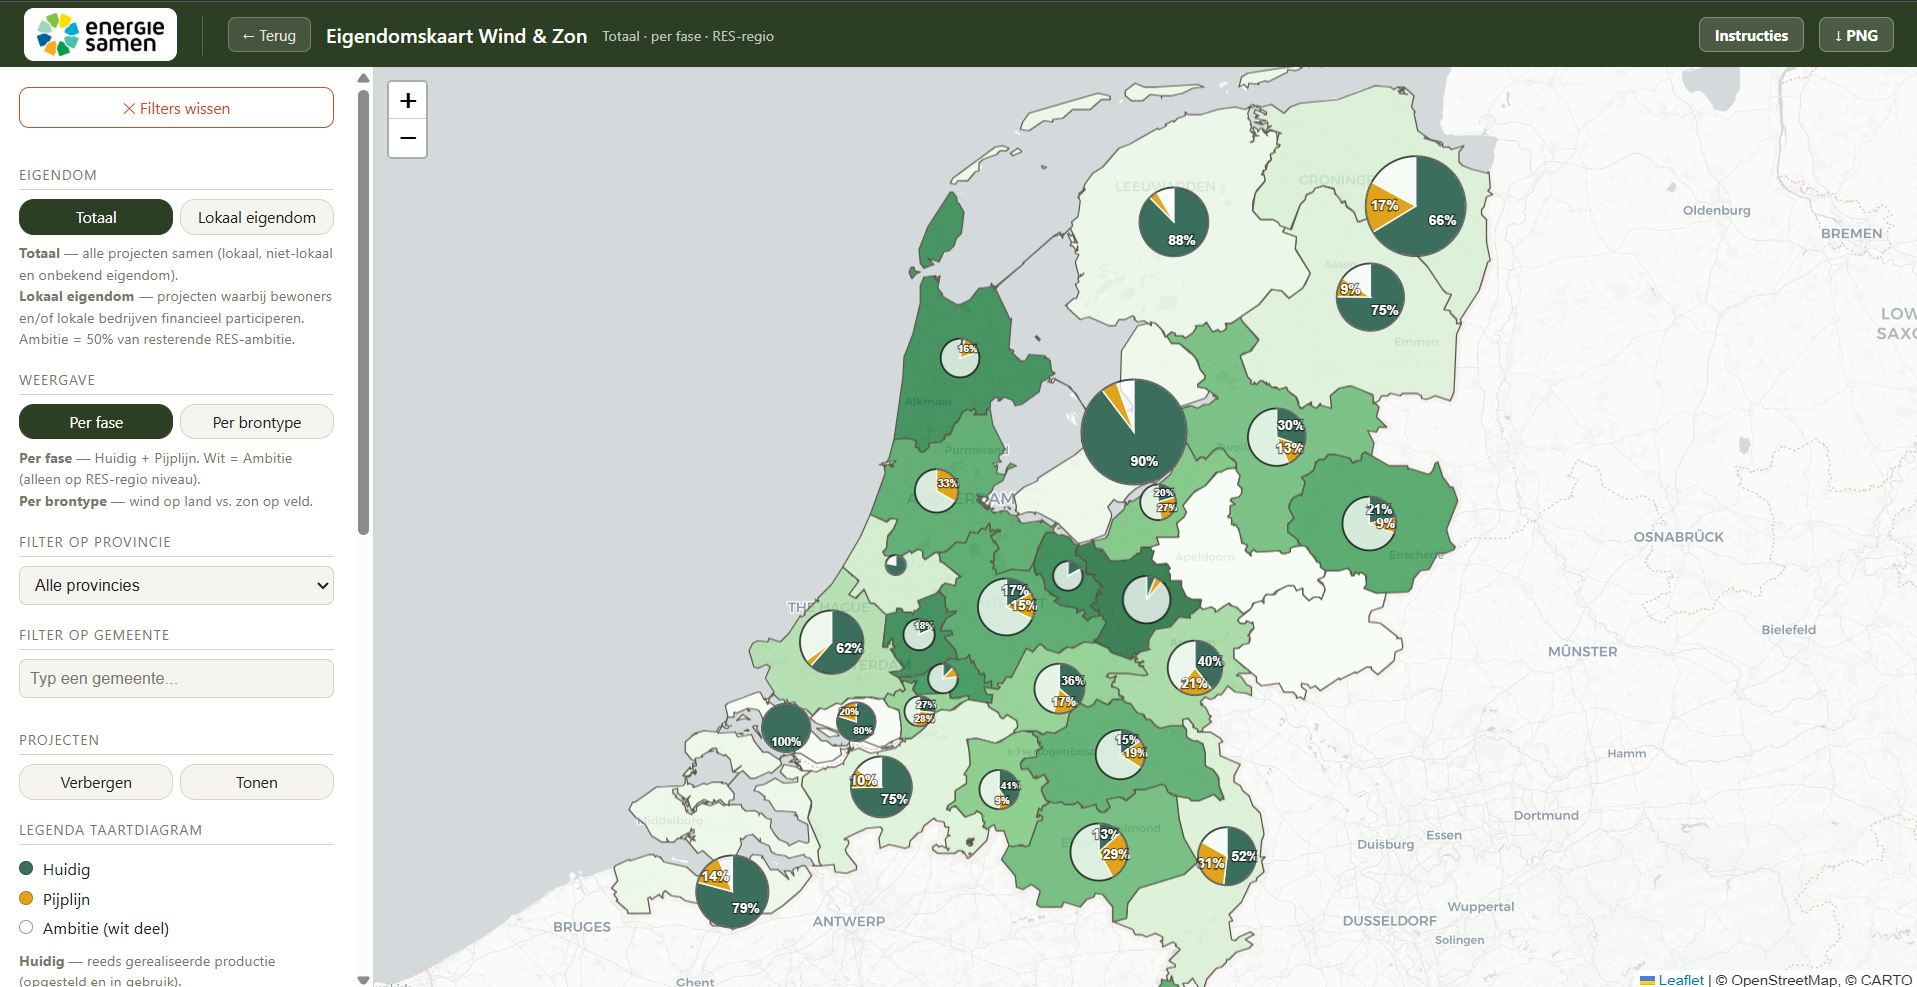
I built a browser-based tool on top of the supplied geospatial data, prepared in QGIS and delivered as an interactive HTML map. Users filter by province, municipality or RES region and read progress per area directly: realised production, pipeline, and remaining ambition. A second view maps the national turbine stock by age, so repowering candidates can be identified in seconds.
The tool covers all 30 RES regions and 3,159 wind turbines nationwide.